Over the past year the people and businesses of the United States have been in a constant state of reactionary change! There are shut downs, re-openings, partial closings, personal protective equipment requirements, masks and gloves, hand sanitizer and a lot of craziness going on with people in general and especially with businesses of all sizes and types.
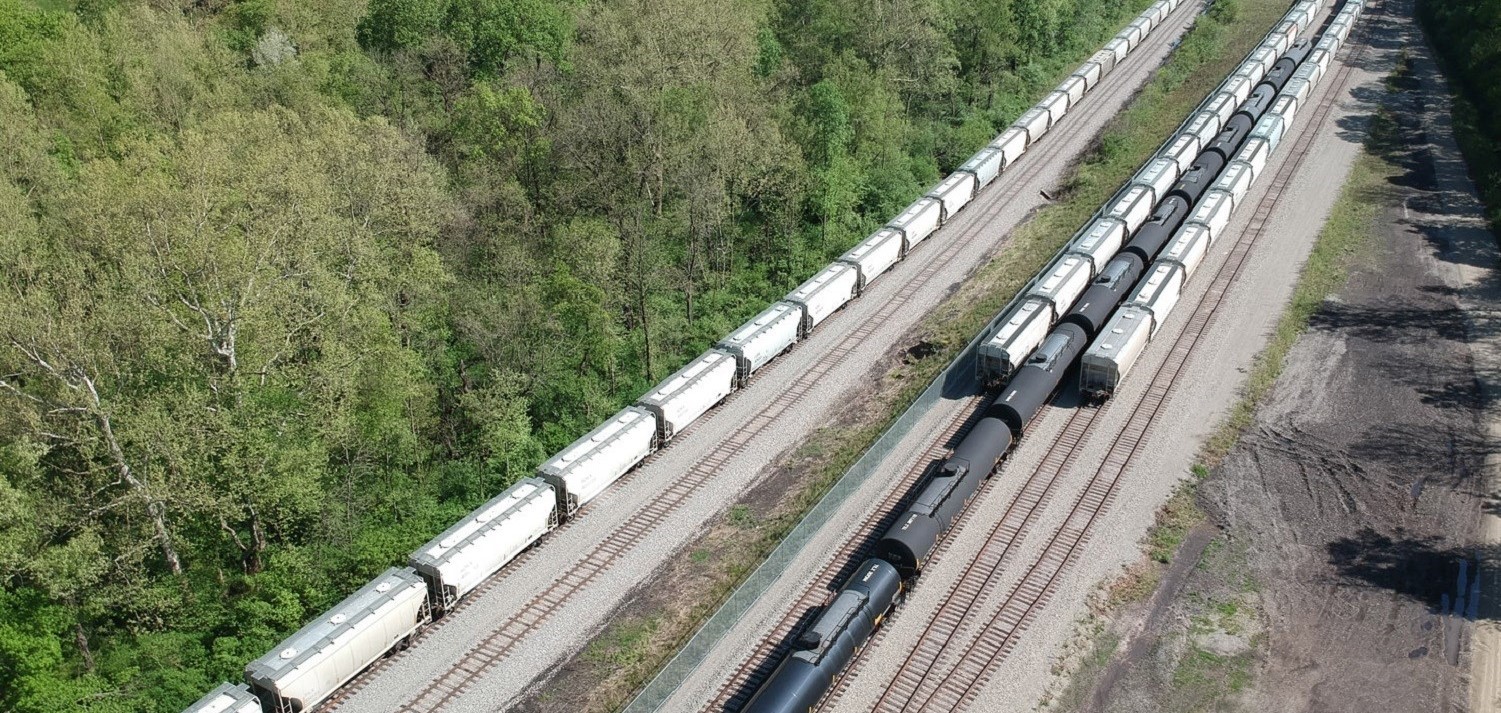
This shutdown has also affected the logistics and transportation world in much the same manner. The logistics and transportation world as it is can be characterized, “steady shipments are like trying to plan around a schizophrenic supply and demand chain.” You never have enough resources to meet the high points and suffer in cash flow and product movement during the low points. At the time of this writing the ports around the United States and Canada in particular the port of Los Angeles and Long Beach are booming with business and there’s hardly a slot left to import a container or find the necessary number of railcars required to transport those containers to waiting consumers. In contrast there are thousands of frac sand covered hoppers and crude oil tank cars waiting for some type of demand to show up so they can be put back to use. Many of these railcars are of the newer type vintage, it’s like parking a Mercedes and only having a dirt road for it to run on. You go out but not often. Demand for these railcars has been drastically reduced due to the sourcing of more local sand via truck in the Permian Basin and the earlier drop in oil prices due to the glut of oil available in the world market. That market has rebounded somewhat but not enough to pull any significant number of railcars out of storage.
As of November1, 2020 according to the Association of American Railroads (“AAR”) there were 439,557 freight railcars in storage. That’s a whopping 26.4% of the entire Northern American rail freight railcar fleet of nearly 1.66 million railcars. As I look back on the Tealinc newsletters I find the November numbers show a tiny improvement over our July 2020 analysis of stored railcars.
By the numbers:
| Car Type | Primary Commodities | Total Cars in Service | Cars in Storage | % in Storage | % of Stored Cars |
| Box cars | Paper, wood, food products | 101,684 | 19,446 | 19% | 4% |
| Covered hoppers | Grain, chemicals, plastics, nonmetallic minerals | 571,521 | 150,648 | 26% | 34% |
| Flats | Container, trailers, lumber, steel, auto | 74,719 | 20,011 | 27% | 5% |
| Gondolas | Coal, metals, scrap | 200,882 | 57,364 | 29% | 13% |
| Hoppers | Coal, metallic ores, nonmetallic minerals | 125,187 | 38,845 | 31% | 9% |
| Intermodal | Containers, trailers | 73,809 | 7,335 | 10% | 2% |
| Refrigerator | Food and farm products, chemicals | 10,662 | 3,585 | 34% | 1% |
| Tanks | Chemicals, petroleum, food products | 440,243 | 137,786 | 31% | 31% |
| Vehicle Flats | Autos | 65,200 | 4,557 | 7% | 1% |
| Grand Total | 1,663,867 | 439,557 | 26% | 100% |
A quick analysis of the table points to the business lines that support these railcar loadings and the railcar loads of individual commodities they represent. Covered hoppers are suffering from two major areas. The lack of frac sand business and the lack of export grain shipments to Asian and European countries. The majority of the covered hopper surplus are comprised of two distinct types of railcars, the frac cars being two pocket 3200 cubic feet capacity, 286k gross weight on rail and the grain cars being an array generally depicted by age from 4750 to 5400 cubic feet capacity with 263k to 286k gross weight on rail. Plastic pellet, pressure differential and specialty covered hopper such as sparger railcars are not as deeply affected.
Flat railcars are suffering from base business impacts to the steel industry, lumber industry and steel making business. In the steel industry it’s all an upstream business driven by automobile sales, structural steel sales for bridges, infrastructure, buildings, etc. The long and drawn out quagmire of lumber related issues such as obtaining supplies of logs, profitability of mills and import restrictions are negatively effecting railcar demand.
Gondolas and hoppers are suffering mostly from the magnanimous decline in coal fired generation over the past several years. Since 2014 coal production coal production has dropped approximately 300 million short tons, around 30%. Coal used to be the number one commodity handled by railroads having carloads representing around 35% of their carload originations business now represents around 25% of the same business. Ten percent doesn’t seem like such a large number until you quantify it on losses of one million plus railcar loads a year. It takes a lot of railcars to support the peak times, railcars that still have utility value but no home.
Tank railcars represent the largest group of railcars in service at approximately 440,000 railcars. There are two factors that drove the surplus. The first is the crude oil price drop due to the market pricing adjustment to OPEC and Russian oversupplying world oil stocks which dropped demand for crude oil out of areas like the Bakken in North Dakota. The second stems from a horrific derailment in Canada a few years ago that essentially pointed to the fact that the current style of tank car wasn’t adequately constructed to withstand strong impacts. This left a lot of tank railcar supply in limbo as owners decided whether to refurbish them with the suggested modifications so they would qualify to run or scrap them. Many of the later group are still in storage and have been so for quite a long time.
Three groups comprised of covered hoppers, gondolas and tank cars together comprise 78% of the surplus of railcars. There were demand points that can be attributed to this surplus they would be the downturn in the energy market (crude oil pricing, coal supply decrease) and the grain market downturn due to fewer exports and lackluster domestic demand.
There are a lot of projections for 2021 in the rail sector. These can be summarized and found in our upcoming January 2021 newsletter. Cautious optimism abounds and that’s with held breath!